
Description:
Mapping of the facilitators and enablers which promote pharmacy staff participation in research to the Capacity, Opportunity, and Motivation of Behaviour change at the individual, team and organisational level.
Brief:
Convert data table into an easy to follow flow chart, highlighting at what level participation occurs, and which of the three components of behaviour change it falls within.
Solution:
The diagram follows the data table in structure, but the sections have been made uniform size regardless of the amount of text they contain, in order to display equal weighting and importance.
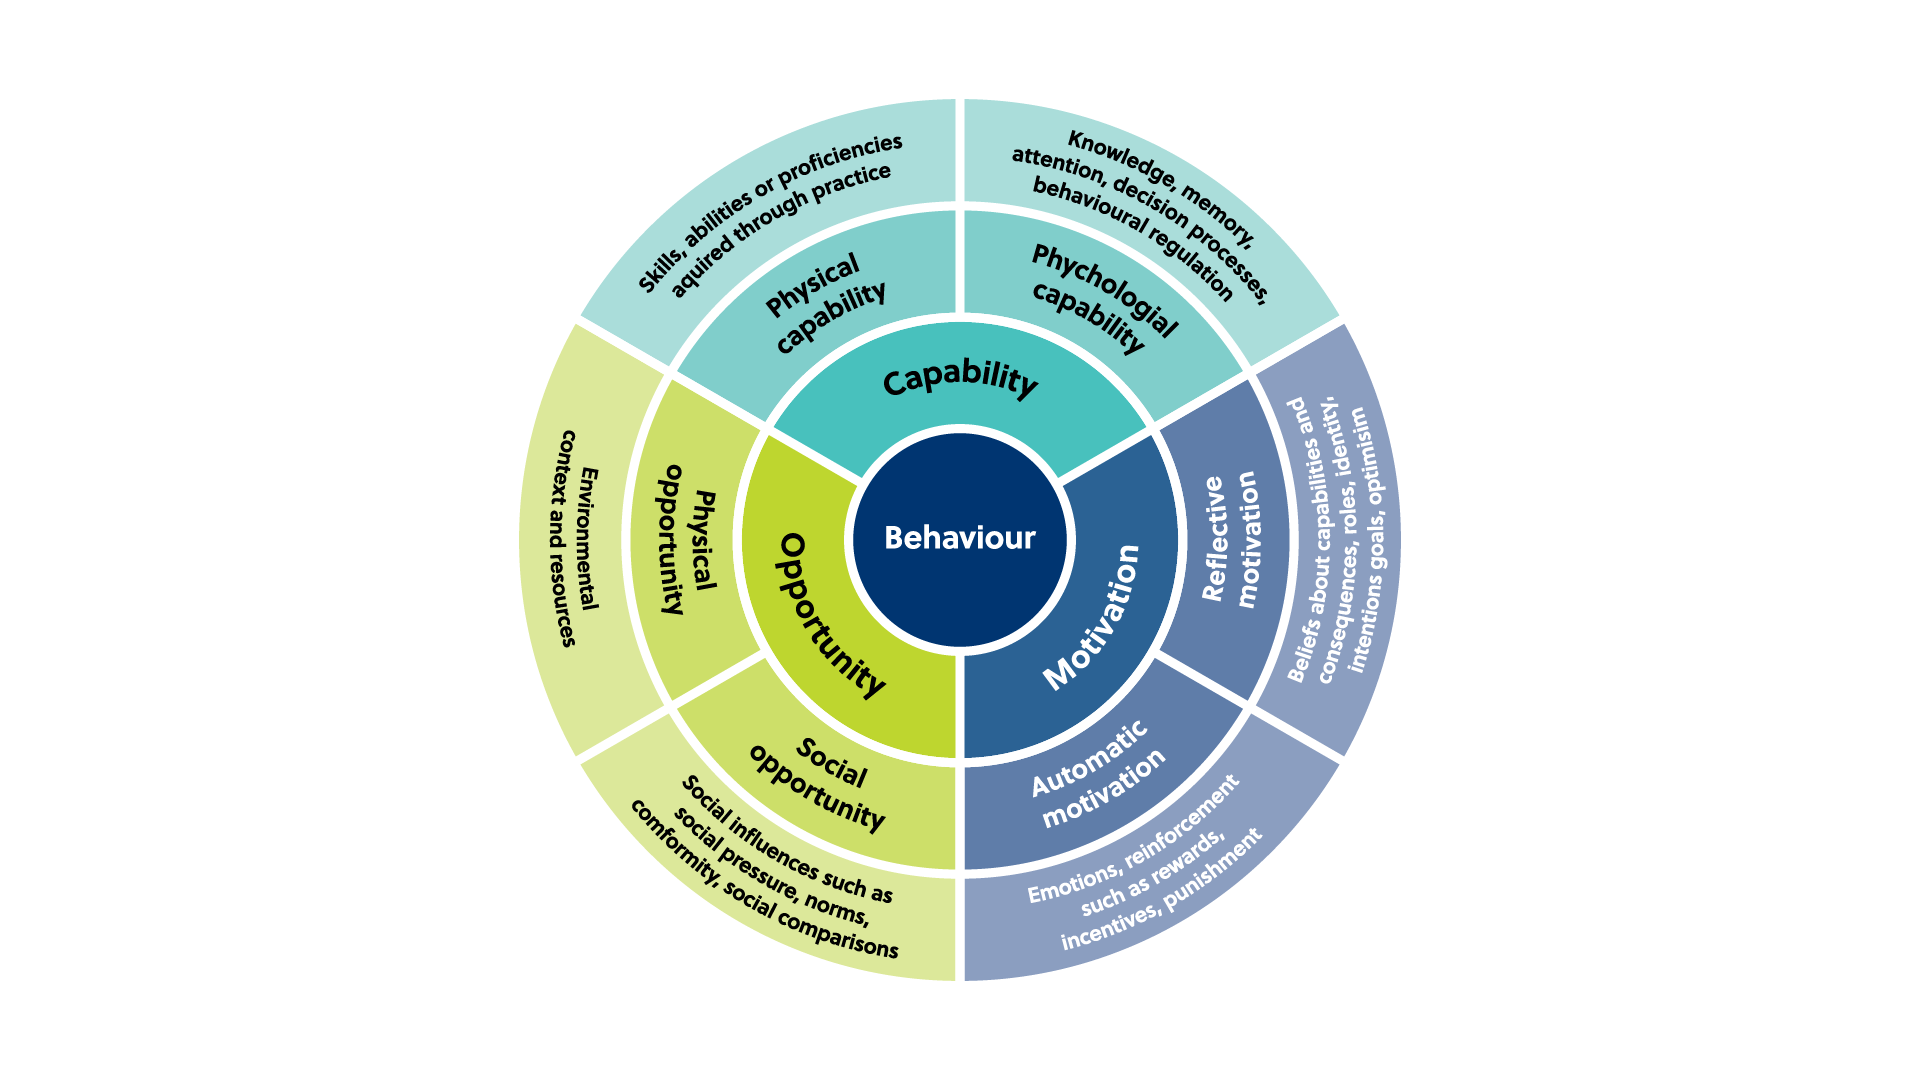
Description:
Illustrate the overarching influences on behavioural change – capacity, opportunity and motivation, and the sub-domains of these influences, linking to definitions and examples for each component.
Brief:
Make a graphic which clearly conveys the three key influences of behavioural change, along with their two sub-categories each, and their respective descriptions for these sub-categories.
Solution:
The three key influences are shown in a different colour from the branding each. In each case the text size decreases and the background tint is decreased to show the hierarchy to the reader.