Description:
A flowchart summarising the number of studies excluded and included at each stage during the screening process of a research systematic review.
Brief:
Transform a data table into a visually appealing flowchart graphic, matching an established brand style, while also making it easy for the reader to follow.
Solution:
The flowchart maintains the same content as the original data table but has been formatted with consistent size and spacing, and color-matched to the existing brand.
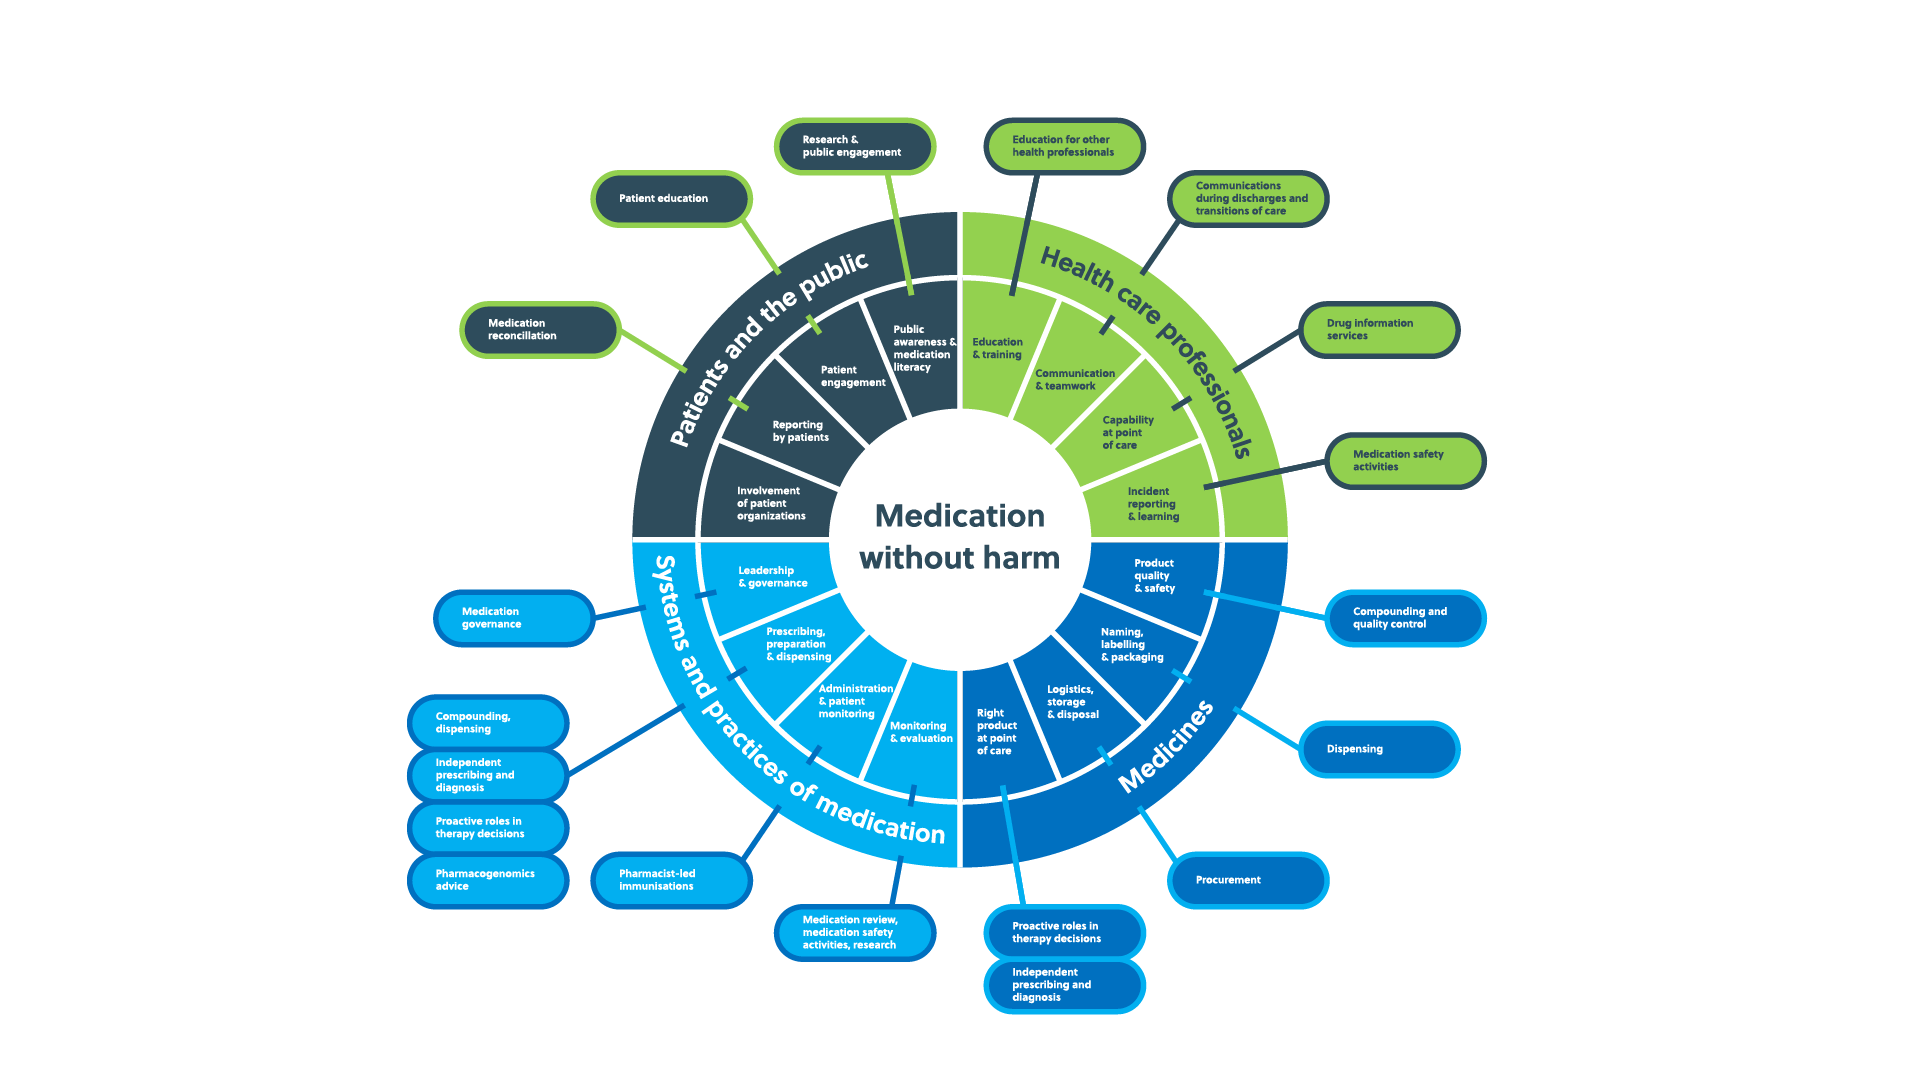
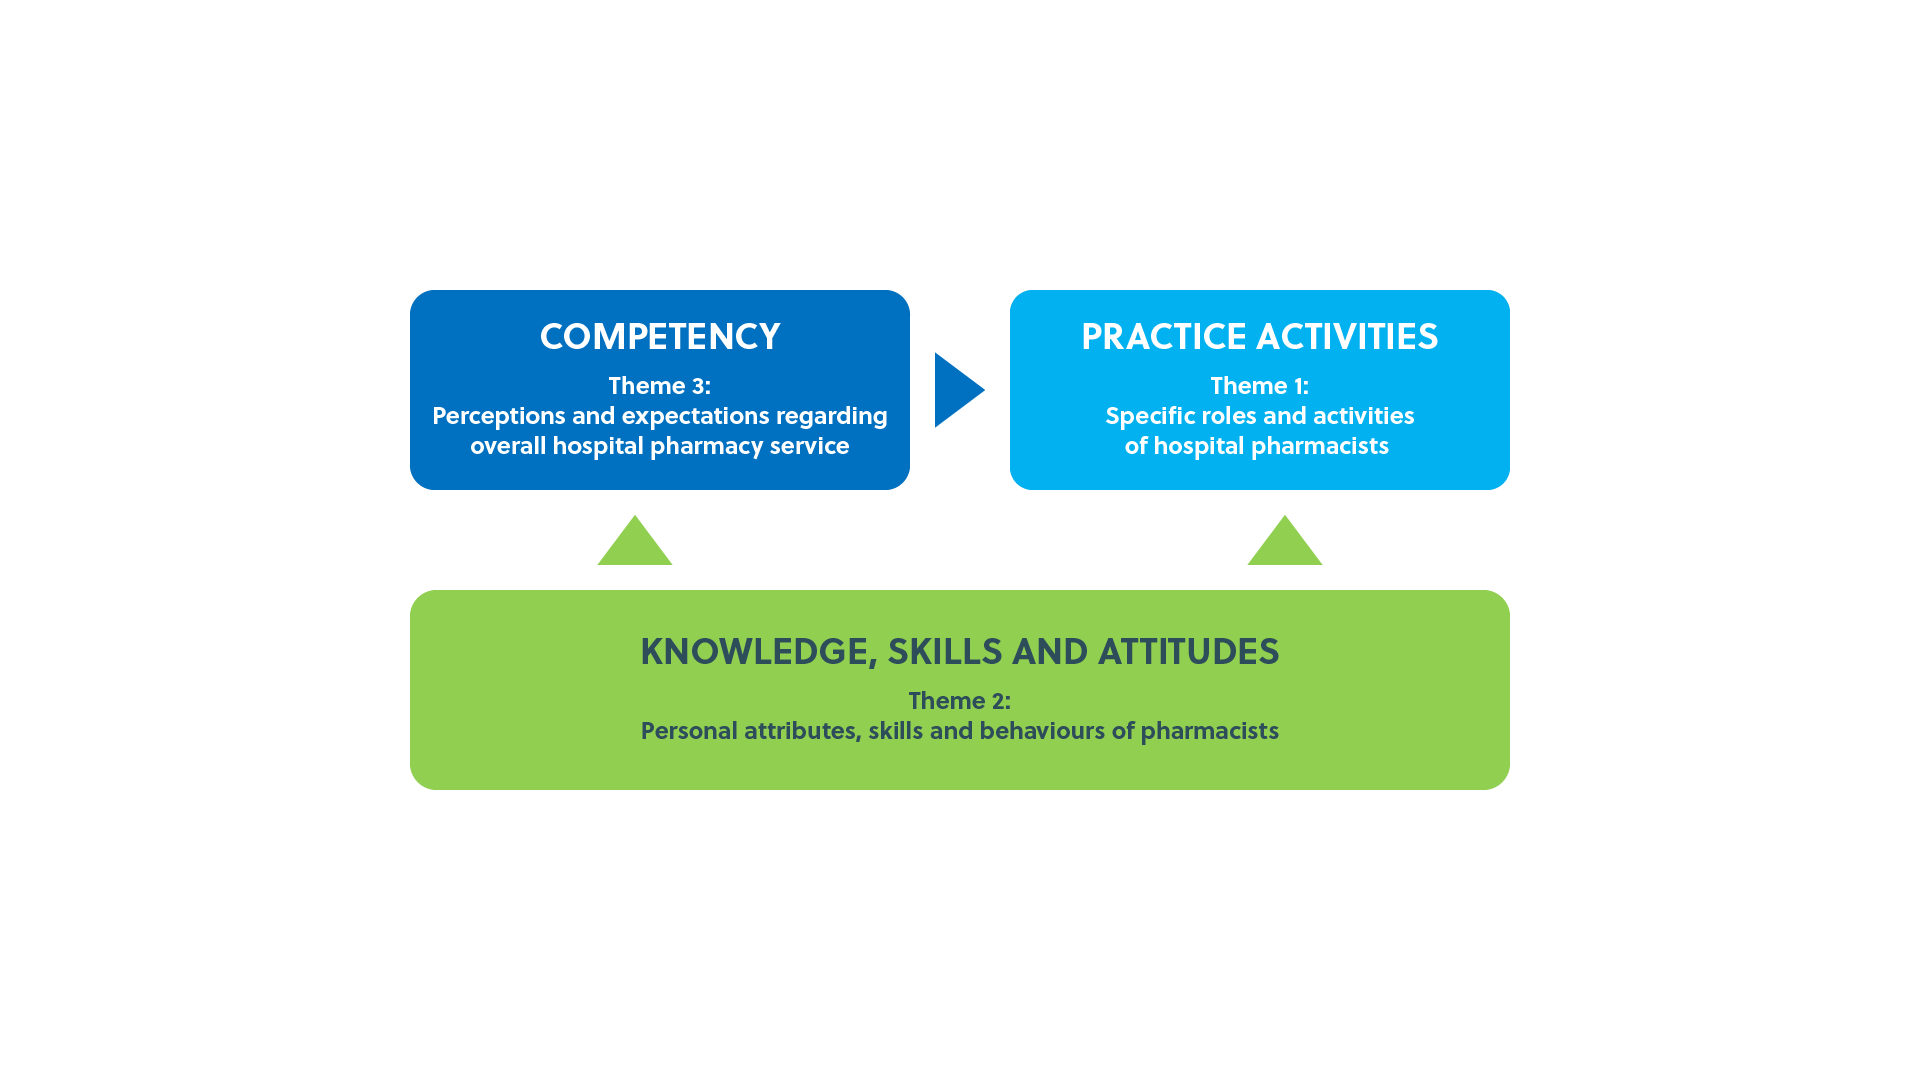
Description:
A graphic that highlights the roles of hospital pharmacists identified by other health professionals, but also highlights the additional roles that pharmacists have.
Brief:
Create a graphic that communicates the perceptions of hospital pharmacist roles from other health professionals, while also showing their actual additional roles.
Solution:
The pharmacist roles are split into four sections, with the perceptions from other health professionals on the inside and the actual additional roles on the outside.